
Xdebug is a PHP debugging extension that allows you to follow the code execution flow of your application (while running on a server) through your IDE. It allows you to control the execution (e.g line-by-line or function by function), pause the execution at any point and examine which variables are defined and the values they contain. It was build in 2002.
In order to use XDebug you need:
(a) To configure your IDE so that it can be use XDebug
PHPStorm has integrated XDebug support. So, the only thing we need is to select:
Run -> Start listening for PHP Debug connections
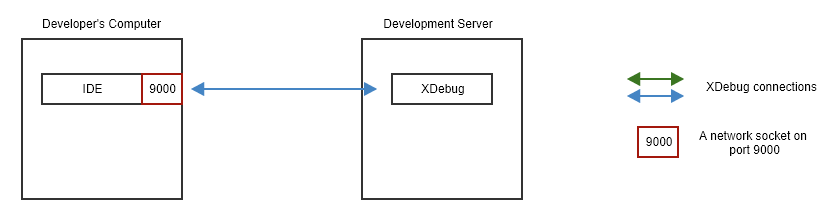
from the menu or press the relevant button on the toolbar. By doing that, PHPStorm opens a socket on which the XDebug extension from your server can connect. The default port that is being used for this socket is 9000.
Note: Make sure port 9000 is not being by another process! For example, PHP-FPM may also use port 9000. If you are on linux you can check the port 9000 (or whichever port you are using for XDebug) listeners by:
# lsof -n -i:9000 | grep LISTEN
(b) To install the XDebug extension on the server your PHP application is running.
On Ubuntu (for PHP 7.1):
sudo apt-get install php7.1-xdebug
You can check that XDebug is there by typing:
ll /etc/php/7.1/mods-available
After that, you need to configure XDebug by editing the php.ini . Sometimes, there is a separate configuration file named xdebug.ini that is being included by php.ini and you can use that.
/etc/php/7.1/mods-available/xdebug.ini
Some basic configuration is:
zend_extension=xdebug.so
xdebug.show_error_trace=1
When this setting is set to 1, Xdebug will show a stack trace whenever an Error is raised – even if this Error is actually caught.
xdebug.remote_enable=1
This switch controls whether Xdebug should try to contact a debug client which is listening on the host and port as set with the settings xdebug.remote_host and xdebug.remote_port. If a connection can not be established the script will just continue as if this setting was 0.
xdebug.remote_port=9008
The port to which Xdebug tries to connect on the remote host. Port 9000 is the default for both the client and the bundled debugclient. As many clients use this port number, it is best to leave this setting unchanged.
xdebug.remote_host=23.132.24.55
Selects the host where the debug client is running. On this IP address and port Xdebug expects to find a listening IDE. You can either use a host name, IP address, or ‘unix:///path/to/sock’ for a Unix domain socket.
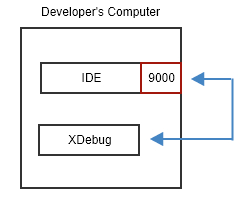
This IP address can just be 127.0.0.1 in case your IDE and web server/CLI script run on the same machine.
This setting is ignored if xdebug.remote_connect_back is enabled.
xdebug.remote_connect_back=0
If enabled, the xdebug.remote_host setting is ignored and Xdebug will try to connect to the client that made the HTTP request. It checks the $_SERVER[‘HTTP_X_FORWARDED_FOR’] and $_SERVER[‘REMOTE_ADDR’] variables to find out which IP address to use.
This setting does not apply for debugging through the CLI, as the $SERVER header variables are not available there.
Please note that there is no filter available, and anybody who can connect to the webserver will then be able to start a debugging session, even if their address does not match xdebug.remote_host.
(c) To make sure the communication between your server and your IDE is feasible.
– Open the relevant port on your computer firewall.
– If you are behind a ADSL router with a public address , forward the relevant port from your ADSL router to your computer
– If your behind a NAT and you cannot control the forwarding, there are two solutions:
In case you are working for a company and there are networks outside the NAT, maybe the sysadmins can set up a DBGp proxy. We will talk a bit later about them.
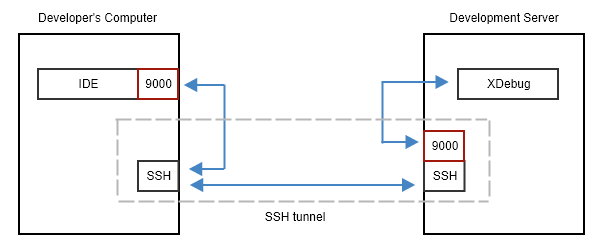
If you don’t access to a network outside NAT (e.g you are working from home with an ADSL line), then you can break through using an SSH tunnel. Executing:
ssh -R 9000:localhost:9000 username@myserverdomnain
This command opens a listening port to your server (so that XDebug can connect to it) and forward it to your computer. The only thing we need to do is to set XDebug to connect at localhost and port 9000. The connection will be tunneled to our computer at port 9000 where our IDE is listening (if configured appropriately).
If you are on a Windows machine and you are used to Putty, there is a relevant configuration that you can use. Set up a normal session and then go to:
Connection -> SSH -> Tunnels
set the “Source Port” to “9000”, “Destination” to “localhost:9000” and select the “Remote” radio button and click Add. Then go back to Session tab and save the configuration.
(d) Instruct Xdebug to initiate debugging.
XDebug checks each HTTP request for the existance of a specific URL parameter of a cookie in order to determine if it should be activated or not. The first time that you will use XDebug you will need to append the “XDEBUG_SESSION_START=<sesson_name>” parameter to your URL. The session_name can be whatever you want. This will activate XDebug and XDebug will instruct your browser to set a relevant cookie so that you don’t have to use this parameter to every request (after all this is not easy at all since some requests will be using other methods than GET or will be AJAX requests).
In case you are finding that annoying and you don’t want to manually add every time this parameter or don’t even want to remember what exactly was the name of the parameter you had to add, you can add an XDebug plugin to your browser. There are plenty of these out there that add an icon on your browser’s toolbar and then with just a click on this icon you can turn the XDebug on or off.
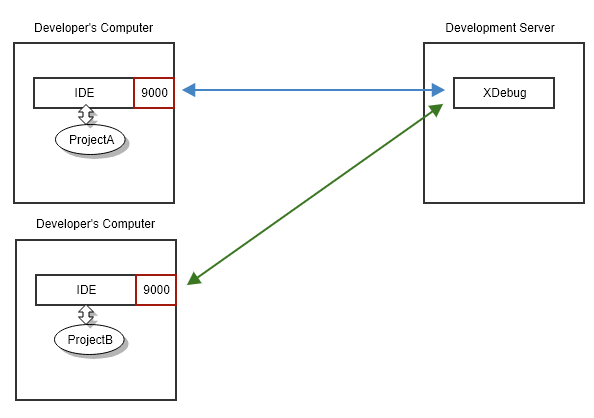
Multiple developers working with same server
We can distinguish two cases here.
(a) Each developer works on a different project and so different directory on the server. This case can be easily handled by using .htaccess files to set a different xdebug.remote_host value for each directory.
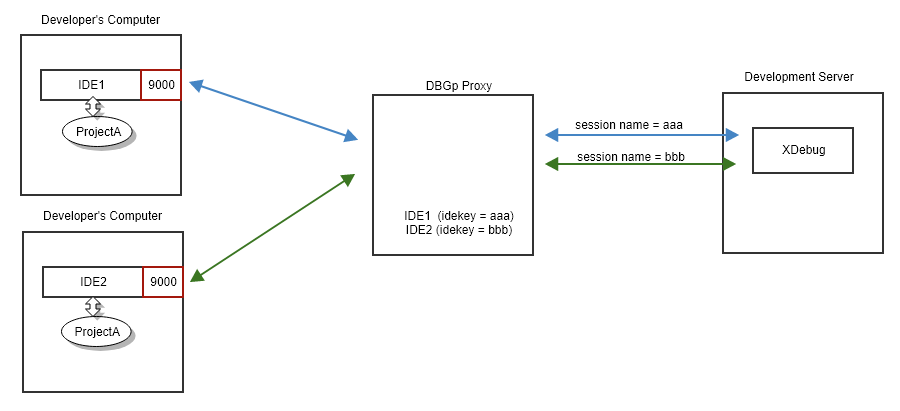
(b) All the developers work with the same project. For such case we need a software called “DBGp proxy”, which acts as a director for DBGp streams. It will acts as a mediator between XDebug and IDEs. Now, the remote_host for XDebug is now the DBGp proxy, which usually, but not necessarily, resides on the development server itself. So, the remote_host can be 127.0.0.1 .
You might be wondering “How the DBGp proxy knows to which IDE the XDebug wants to communicate with ?” . It doesn’t! That’s why each IDE needs to use a unique identifier called “idekey” and register itself to DBGp proxy. The registration can be done using the “proxyinit” command but, usually, the IDE handles the details making your life easier. After that, when a browser activates the XDebug through the XDEBUG_SESSION_START parameter <idekey>” should be used as the session name.
XDebug and PHPStorm
Debugging protocol: PHPStorm uses DBGP. This is a debugging protocol that provides a means of communication between a debugger engine (scripting engine, Virtual Machine, etc.) and a debugger IDE. Zend tried to build another debugging protocol at around 2006 but it seems (maybe I am wrong) that didn’t manage to prevail over DBGp. Their basic differences were:
DBGp PHP IDE protocol
ASCII/XML-based binary
Proxy Server support set IDE host/port through HTTP params
better support for breakpoints
Debugging multi-tier applications and microservices: When you need to debug a request to application A and application A calls application B then things get a little trickier but it is still feasible. The key to make it work is to make your IDE listen for incoming XDebug connections for both your applications and make the code of application A to activate XDebug on application B by sending the relevant parameter or an XDebug cookie. You can find the relevant documentation here:
https://confluence.jetbrains.com/display/PhpStorm/Simultaneous+debugging+sessions+with+PhpStorm